> For the complete documentation index, see [llms.txt](https://docs.datasentinel.io/manual/llms.txt). Markdown versions of documentation pages are available by appending `.md` to page URLs; this page is available as [Markdown](https://docs.datasentinel.io/manual/changelog/2020.md).
# 2020
Datasentinel releases from 2020.
{% updates format="full" %}
{% update date="2020-12-09" tags="feature,improvement,changes" %}
## V2020.12
#### System Metrics
> Datasentinel can obtain system metrics using the Agentless method by installing the [system\_stats](/manual/getting-started/postgresql-clusters/extensions/system_stats.md) extension
#### Top Tables
> Visualize the most commonly used Tables or Indexes, based on metrics like disk reads, cache activity, or any other specified criterion.
{% content-ref url="/spaces/lcWi6G1jtNuyGT9C0pkc/pages/lFr0z3k5xwmT0MTOQjC9" %}
[Top Tables](/manual/features/key-features/top-tables.md)
{% endcontent-ref %}
#### Version Naming
> New version name convention
> {% endupdate %}
{% update date="2020-05-11" tags="feature,changes" %}
## V1.6.0
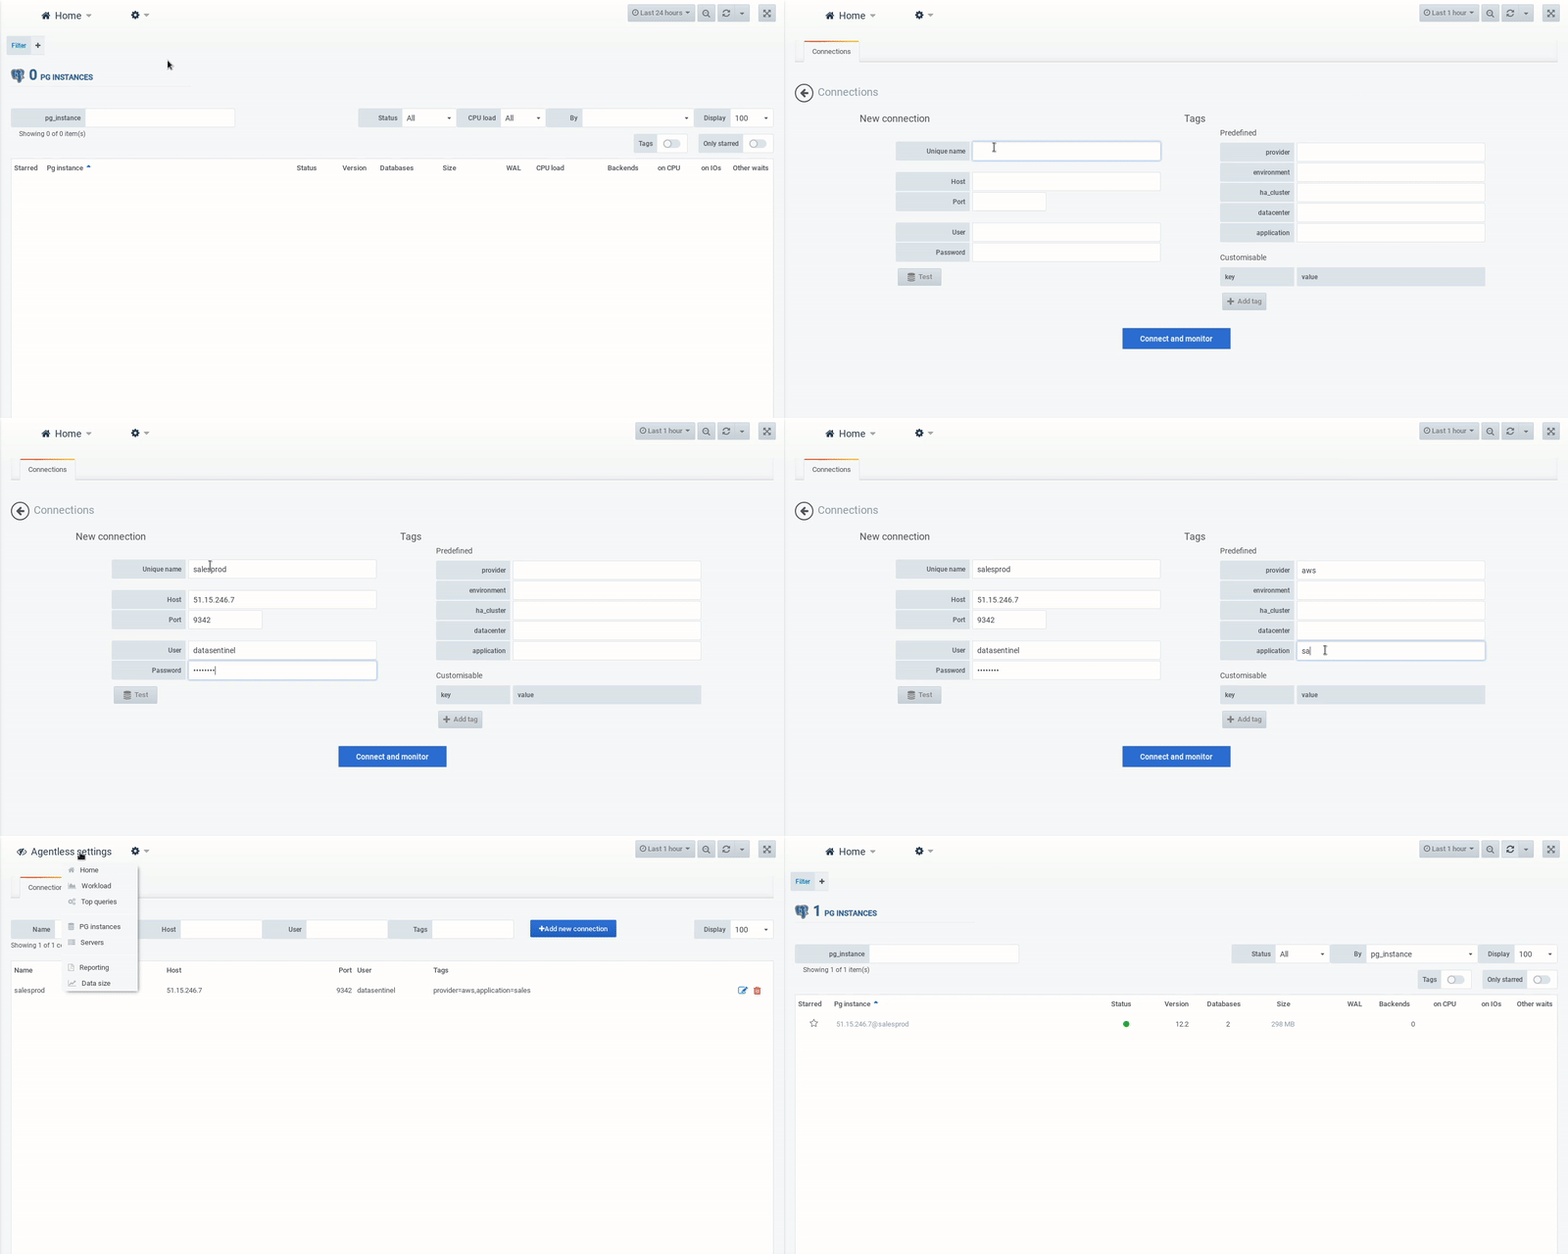
#### Agentless method
> Introducing the latest Agentless version, offering comprehensive monitoring capabilities for a wide range of PostgreSQL instances, including:
>
> * AWS RDS and Aurora
> * Microsoft Azure databases, including hyperscale
> * Google Cloud SQL, as well as other cloud providers.
{% endupdate %}
{% update date="2020-03-30" tags="feature,fix,changes,fixes" %}
## V1.5.0
#### Reporting
> We've introduced a Reporting feature, which includes the ability to generate PDF reports. Additionally, you can create your reports programmatically using the API.
{% content-ref url="/spaces/lcWi6G1jtNuyGT9C0pkc/pages/YH3ebvTtm0lvj5P9FGIg" %}
[Reporting](/manual/features/key-features/reporting.md)
{% endcontent-ref %}
#### Fixes
* Fix pagination on some dashboards in the UI.
{% endupdate %}
{% update date="2020-02-18" tags="feature,improvement,fix,changes,fixes" %}
## V1.4.0
#### Top Queries
> Query statistics display the minimum and maximum execution time
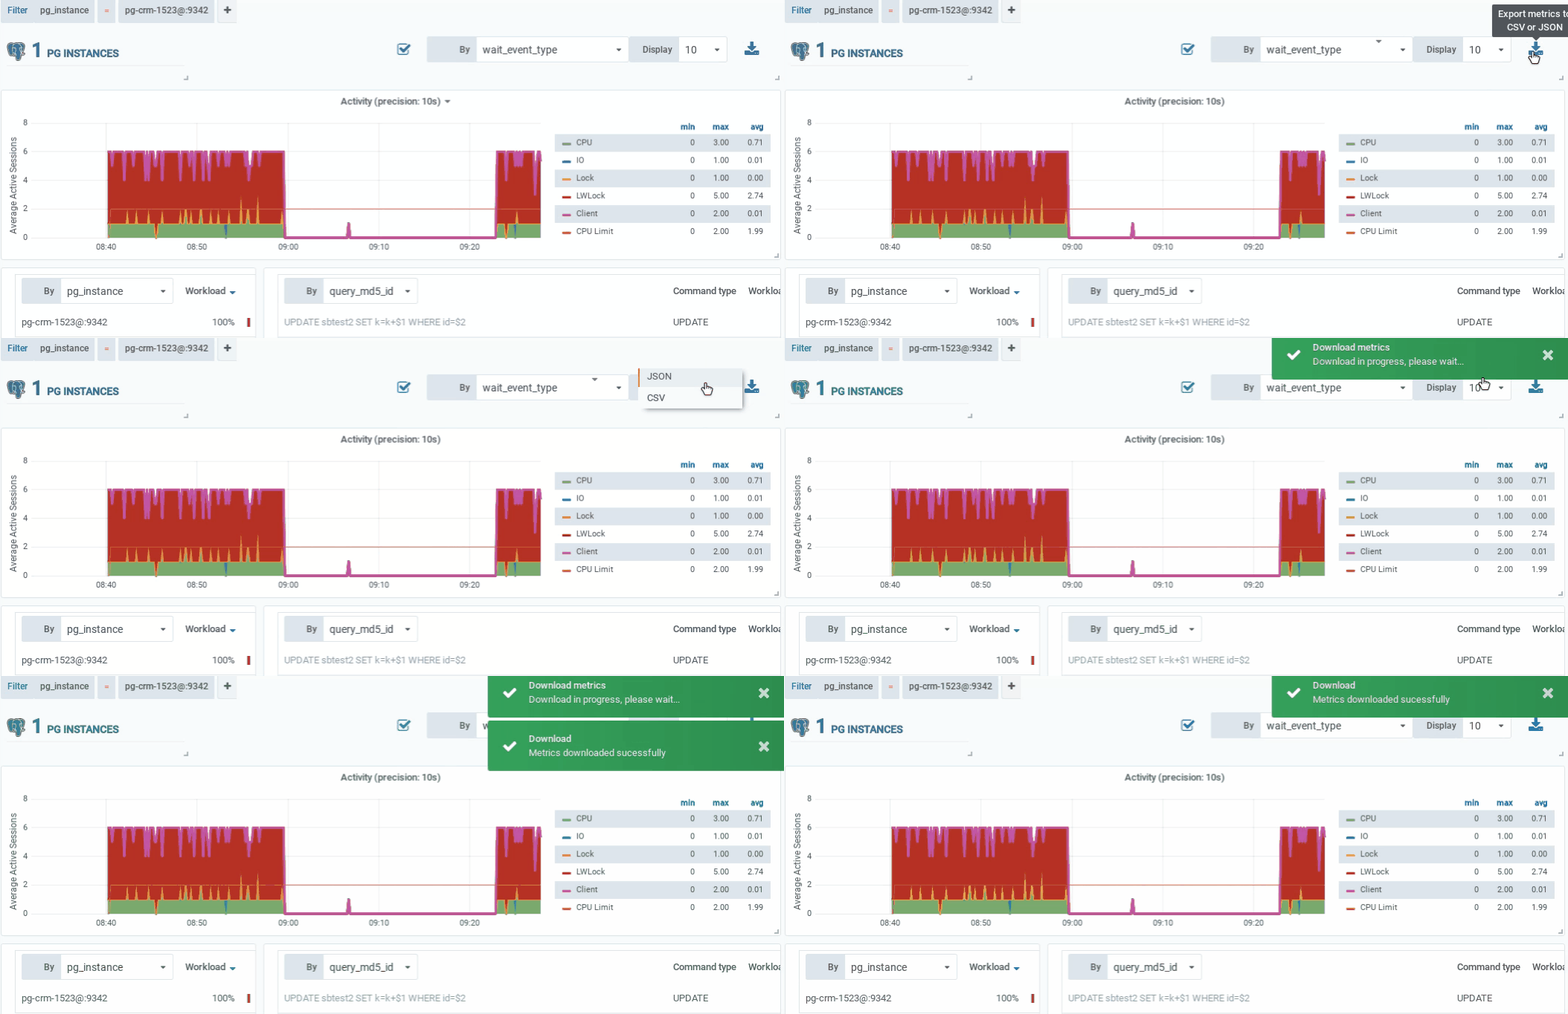
#### Export Metrics
> Metrics can now be directly downloaded from the user interface.\
> JSON or CSV format
Export Metrics in JSON or CSV format
#### Fixes
* Fix layout in the top queries dashboard
* Fix tab layout in the instance dashboard
{% endupdate %}
{% update date="2020-01-14" tags="feature,fix,changes,fixes" %}
## V1.3.0
#### Execution Plans
> Analyzing execution plans is now simplified with the Plan Viewer feature. You have the flexibility to copy/paste existing plans in text or JSON format, as well as view them directly within the execution plans dashboard.
Execution Plan viewer
#### Index usage
> Index usage statistics are now accessible, allowing you to identify the most frequently used indexes.
{% content-ref url="/spaces/lcWi6G1jtNuyGT9C0pkc/pages/lFr0z3k5xwmT0MTOQjC9" %}
[Top Tables](/manual/features/key-features/top-tables.md)
{% endcontent-ref %}
#### Fixes
* In the [Top Queries](/manual/features/key-features/top-queries.md) dashboard, labels display the sql text (truncated if needed) instead of the query md5 id.
{% endupdate %}
{% endupdates %}
---
# Agent Instructions
This documentation is published with GitBook. GitBook is the documentation platform designed so that both humans and AI agents can read, navigate, and reason over technical content effectively. Learn more at gitbook.com.
## Querying This Documentation
If you need additional information that is not directly available in this page, you can query the documentation by asking a question.
Perform an HTTP GET request on the following URL with the `ask` and `goal` query parameters:
```
GET https://docs.datasentinel.io/manual/changelog/2020.md?ask=&goal=
```
`ask` is the immediate question: it should be specific, self-contained, and written in natural language.
`goal` is what the user is ultimately trying to achieve, the reason they need the answer. Sharing it helps GitBook give you a better, more relevant answer. A goal is most helpful when it describes the outcome the user wants rather than restating the question. For example, with `ask=how do I create an API token`, a goal like `automate deployments from our CI pipeline` lets GitBook tailor the answer to that use case.
The response will contain a direct answer to the question and relevant excerpts and sources from the documentation.
Use this mechanism when the answer is not explicitly present in the current page, you need clarification or additional context, or you want to retrieve related documentation sections.