๐Ÿ“ฃRelease Notes

Please refer to the documentation to upgrade Datasentinel.

๐Ÿท๏ธ v2024.10

Oct 18, 2024

PostgreSQL 17

Fully compatible with the latest PostgreSQL 17 release

Libraries

The backend includes upgraded third-party libraries for better performance, security, and compatibility

Agent v3.6.0

Refer to the Agent Release Notes

๐Ÿ”ง Fixes

  • Tags are lost in memory (though still persisted on disk) when updating an agentless connection without specifying them.

๐Ÿท๏ธ v2024.04

Apr 10, 2024

Role Based Access

Users can be assigned multiple roles, moving beyond the previous one-role limit. This update offers increased flexibility and precision in access control, available both through the UI and API, enhancing both ease of use and security

Please be aware that the role field in our User API has been deprecated. We've introduced the new field roles as its replacement. roles is designed to accommodate multiple roles for a single user.

Agent v3.5.2

Refer to the Agent Release Notes

๐Ÿท๏ธ v2024.02

Feb 15, 2024

Role-Based Access Control

We've introduced an option to manage access for users created via LDAP integration. By default, such users have access to all instances. With this update, you can choose to restrict user access until a specific role is assigned in their properties. This option is configurable through the Global Settings Dashboard, offering better control over permissions.

๐Ÿ”ง Fixes

  • Fixed a bug where the backend API failed to start if the PID in /datasentinel/log/.pid_datasentinel_apis was active but belonged to another process.

๐Ÿท๏ธ v2024.01

Jan 22, 2024

I/O Insights

PostgreSQL 16 introduces an exciting enhancement to database monitoring and performance tuning with the pg_stat_io system view.

This feature provides detailed insights into the I/O behavior of PostgreSQL servers. A new dashboard has been introduced, starting from version 16, to facilitate a deeper understanding of I/O insights.

Wait Event Descriptions

Updated wait event descriptions to reflect the latest version's details. Refer to our Documentation for guidance on displaying wait event descriptions effectively in your monitoring workflow.

โ“Wait Event Description

Chart Design

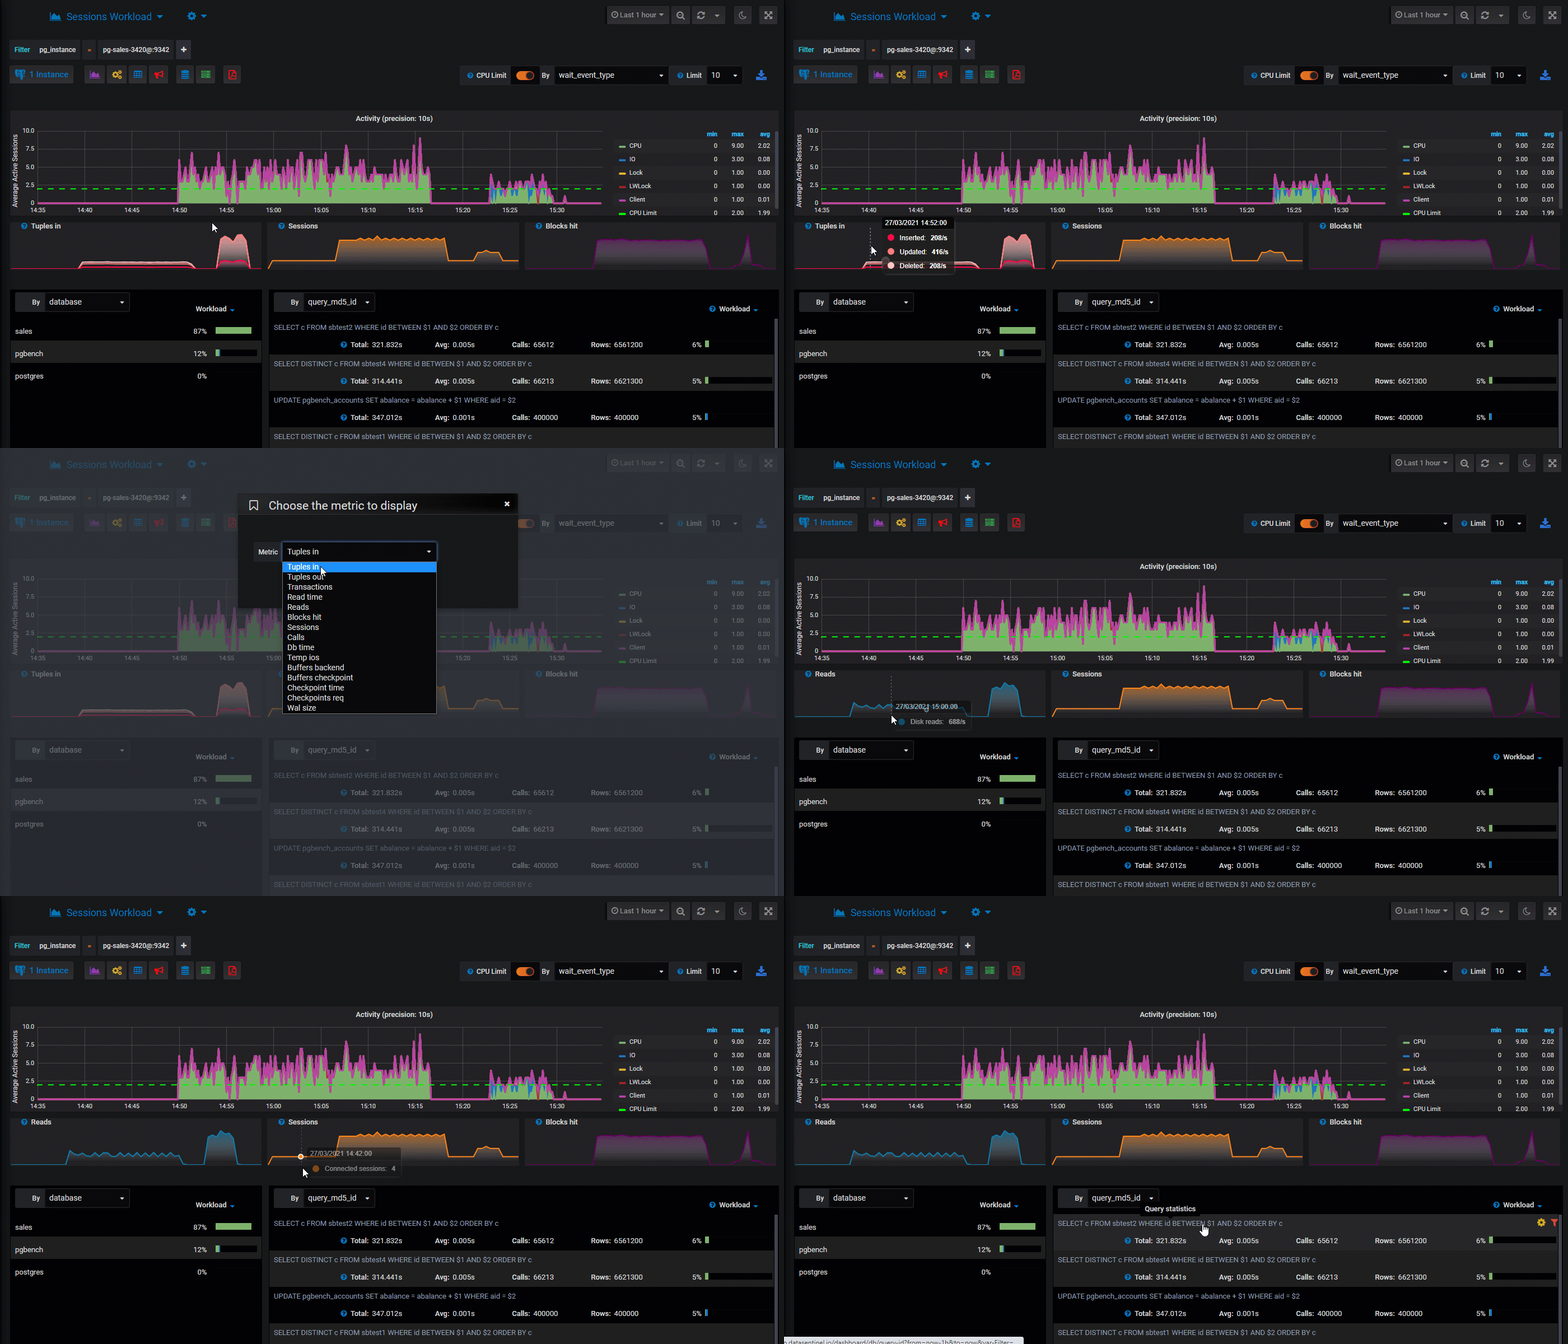
Update colors in main Session History chart for more clarity. Real-time illustration โ–ถ

Transformed the Top Queries chart into a staircase chart for enhanced data visualization Real-time illustration โ–ถ

Agentless Method

- Settings Dashboard

Each monitored instance now displays its corresponding local agent Id. This makes it easier for users to identify specific instances, especially when managing a large number of databases.

Dynamic Filters for Enhanced Navigation

  • Monitoring Status Filter Quickly filter instances by their monitoring status

  • Connection State Filter This filter allows users to view instances based on their connection state, enabling quick toggling between enabled or disabled states.

  • Agent ID Filter Efficiently locate instances using their local agent Id.

- Startup process

We've enhanced our Agentless service startup, ensuring quicker launch times and improved performance, especially beneficial for large-instance environments during system boots or post-upgrade reboots.

- Error Logging

Log any issues encountered during instance monitoring, such as initialization errors, directly into the platform. These issues are then displayed in the UI.

Real-time illustration โ–ถ

๐Ÿ“กAgentless Monitoring

Registered Instances Dashboard

Each registered instance now displays its monitoring status.

Added Monitoring Status Filter Quickly filter instances by their monitoring status Real-time illustration โ–ถ

Tooling

A new tool, dump_config.sh, has been incorporated into our suite of scripts, in order to dump defined roles, user settings, agentless connections, and alert rules.

These are saved in multiple dump*.txt files in InfluxQL format, perfect for restoration or migration purposes on other platforms.

๐Ÿ› ๏ธTooling

LDAP Users

The API now supports the creation of LDAP users.

๐ŸงฉUser API

Instance Display

โ˜‘๏ธSimplified pg_instance Display

Contextual Documentation

Enhance your dashboard experience with two new buttons!

The first button brings you a Tip of the Day, offering daily insights to improve your usage and knowledge of Datasentinel. The second button instantly connects you to relevant documentation for your current dashboard context, making information access quick and effortless.

PostgreSQL

The embedded PostgreSQL database is now in version 15.5 during a full installation

New Agent V3.5.0

Fully compatible with the newest release, PostgreSQL Version 16.

Updated third-party libraries.

Send any issues encountered during instance monitoring directly to the platform.

๐Ÿ”„Agent

๐Ÿ”ง Fixes

  • In the blocked session panel, the database and users are reversed, displaying user information under database and vice versa. Real-time illustration โ–ถ

  • The total size of the Generated WAL displayed is inaccurate in the PostgreSQL Instance Information panel. Real-time illustration โ–ถ

  • Tooltip display issue in the charts on the homepage when using the Dark Theme. Real-time illustration โ–ถ

  • When a user is configured with Role-Based Access, the Server Metrics fail to display.


๐Ÿท๏ธ v2023.07

Sep 1, 2023

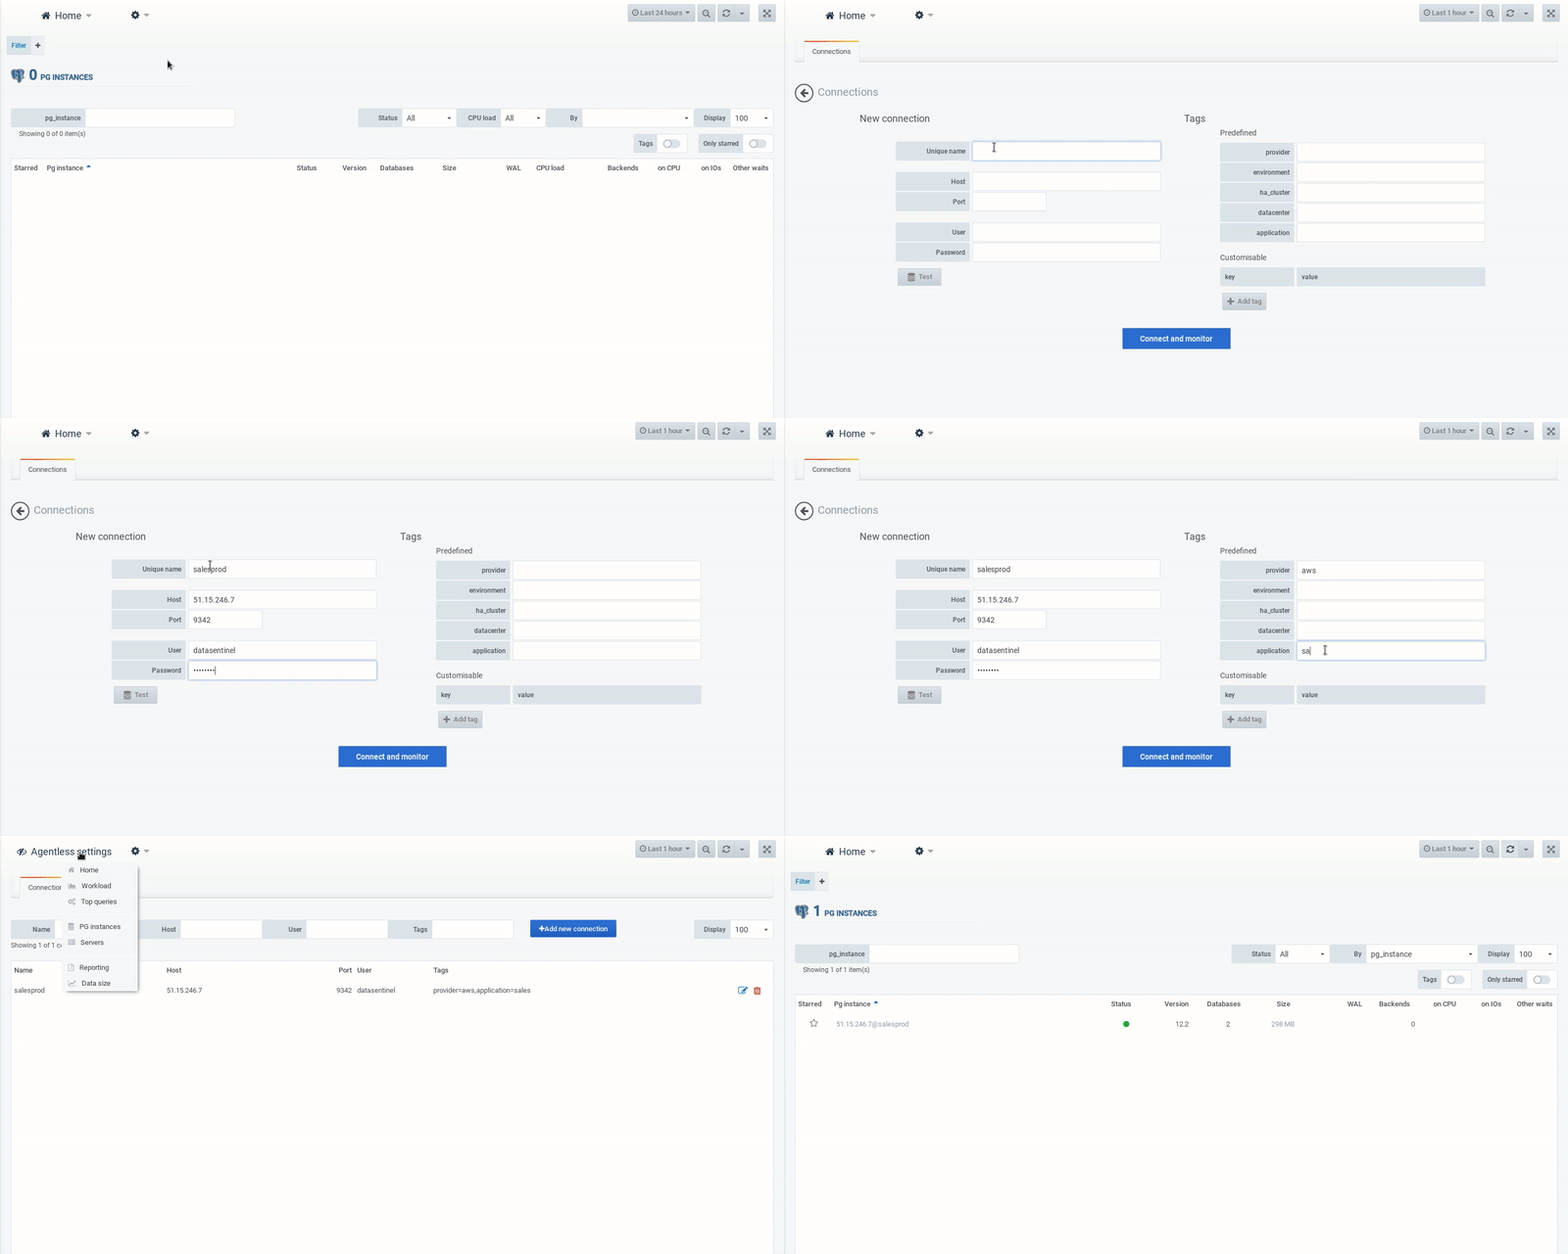
Agentless Configuration

Enhanced provider selection functionality: added the ability to choose a provider from a predefined list of values.Added Fujitsu Enterprise Postgres as a new provider option when configuring a new instance.

When selecting this provider, the port is automatically set to their default port.

Improved visual representation by displaying the Fujitsu Enterprise Postgres icon alongside each relevant PG instance in Datasentinelโ€™s navigation.

System Metrics

Introduced direct access to system metric dashboards via the pg_instance name, eliminating the requirement for the server name and resolving filter-related issues. Real-time illustration โ–ถ๏ธ

๐Ÿ”ง Fixes

  • Improved scrolling functionality in the dashboard for file-systems with a large number of entries.

    Added the ability to sort file-systems by any property. Real-time illustration โ–ถ๏ธ

  • Inaccurate outcomes appear on the Top Queries dashboard when multiple query IDs are associated with a single statement in pg_stat_statements.


๐Ÿท๏ธ v2023.05

May 10, 2023

Tooling

Tooling is now available as scripts that can be run in a terminal window on one or multiple platforms, enabling you to collect information about Datasentinelโ€™s configuration.

๐Ÿ› ๏ธTooling

Linux Compatibility

Datasentinel is now available on Red Hat Linux 9-compatible distributions such as Rocky Linux 9 or AlmaLinux 9

Python Version

The version of Python used for the backend and the agent has been upgraded to a more recent version, as well as the dependencies used.

๐Ÿ”ง Fixes

  • After updating the token for Agentless connections, the Live360 module is no longer functioning.


๐Ÿท๏ธ v2023.03

March 13, 2023

LDAP Authentication

Datasentinel seamlessly integrates with LDAP for user authentication.

๐Ÿ““LDAP

๐Ÿ”ง Fixes

  • Live360 does not work since upgraded to the version 2023.02

  • When multiple parameter changes are detected, only the last one is displayed (needs agent v3.3)

  • Error when retrieving query texts of specific queries (python drivers)


๐Ÿท๏ธ v2023.02

February 15, 2023

Lock Explorer

Lock explorer makes it easy to identify blocking sessions during blocked session issues, along with the associated queries and locks.

By continuously monitoring lock activity, Datasentinel offers insights into your databaseโ€™s state and assists you in addressing issues by generating blocking scenarios that give comprehensive information about lock activity during blocked session incidents.

Learn about how this feature works by referring to the Lock explorer documentation.

Real-time illustration โ–ถ๏ธ

๐Ÿ”“Lock Explorer

To take advantage of lock explorer capabilities, ensure your agents are updated to at least version 3.0 or higher

Session History

The dashboard displaying activity by process id has been replaced by a more accurate version, now showing activity by user name and client host name. Real-time illustration โ–ถ๏ธ

Changed Parameters

Improved detection of changed parameters. A graphical annotation is now included in the main dashboard graphs to clearly indicate when a parameter change has been detected.

Real-time illustration โ–ถ๏ธ

Collection Level

The Agent version 3.2, introduces the Collection Level feature allowing you to choose the metrics to monitor.

๐Ÿ—ƒ๏ธCollection Level

PostgreSQL

The embedded PostgreSQL database is now in version 14 during a full installation

Fixes

  • Query and Session history reports do not complete if query texts cannot be integrated in the PDF.

  • Execution plans are not displayed when using pg_store_plans >=1.6 on a PostgreSQL cluster < 14.

  • Values of type Decimal returned from Postgresql cannot be serialized to JSON format when using the alerting module.


๐Ÿท๏ธ v2022.11

November 13, 2022

Alerting

Alerting is a new feature in this version, enabling seamless monitoring of your PostgreSQL clusters and providing instant notifications for any detected issues.

Refer the Alerting documentation on how to configure and manage alerts. You also have the capability to generate custom alerts using the Alerting API.

๐Ÿ””Alerting

To take advantage of alerting capabilities, ensure your agents are updated to at least version 3.0 or higher

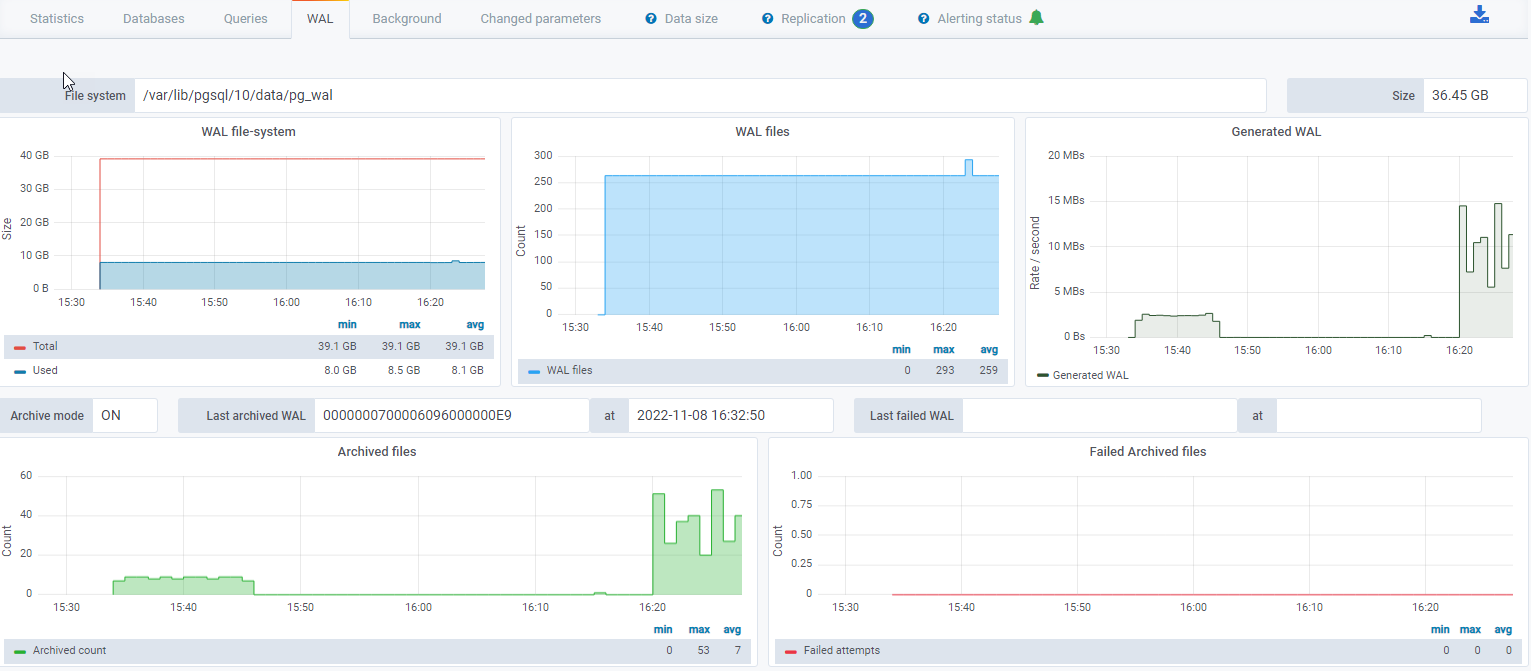
WAL activity

A new dashboard displaying the WAL and Archiving activity for an instance has been added. Real-time illustration โ–ถ๏ธ

Replication

The number of physical replications is now displayed as a badge in the instance statistics dashboard.

PostgreSQL 15

Support for PostgreSQL 15

Fixes

  • Minor bugs fixed

Since this version, logging nginx access and influxdb queries are disabled by default on a fresh installation.

Refer to the FAQ, to configure logging generated by nginx and influxdb


๐Ÿท๏ธ v2022.07

July 19, 2022

Audit

User action auditing mechanism.

๐Ÿ“‹Audit

v2022.06

June 20, 2022

Top Queries

A flag per execution option has been introduced in the Top Queries module, enabling you to calculate metrics on a per-execution basis. For instance, you can display queries that incur the highest disk reads for each execution.

Fixes

  • Retrieval of query execution statistics improved

v2022.05

June 1, 2022

Session History

The session workload module has been renamed to Session History for clarity

Cascading Replication

Datasentinel now makes it possible to monitor all the clusters (primary, replicas) of a cascading PostgreSQL replication.

To take advantage of lock explorer capabilities, ensure your agents are updated to at least version 2.9.5 or higher

๐Ÿท๏ธ v2022.04

May 5, 2022

System Metrics

In addition to the existing PostgreSQL metrics, the 3 small graphs on the Session History, Top Queries, Top Tables dashboards now have the capability to display certain system metrics.

Correlating system activity with PostgreSQL activity becomes even easier and more efficient

Available metrics:

  • Server: busy time

  • Server: load

  • Server: server reads

  • Server: server writes

  • Server: read time

  • Server: write time

  • Server: swap

  • Server: swap activity

  • Server: memory

  • Server: network bytes

  • Server: network packets

Execution Plans

The number of distinct execution plans is now displayed as a badge allowing you to quickly see if multiple plans exist for a query (requires pg_store_plans extension)

Fixes

  • Better fluidity of navigation on the graphical interface

๐Ÿท๏ธ v2022.03

March 31, 2022

Fixes

  • Stopping the backend service now kills any remaining process

  • The scheduler now works in local time and not in utc time

  • The platform and the agent are compatible with the latest version of pg_store_plans (1.6.1)

๐Ÿท๏ธ v2022.02

March 7, 2022

Reporting

Customize and generate a report in a few clicks.

Can include one or multiple instances.

Ability to filter the report on a particular database.

Schedule your daily or weekly reports at the chosen date and time with sending to a mailing list.

Reports can be generated in an automation flow thanks to the Reporting API.

Multiple types of predefined reports.

๐Ÿ“ฐReporting

๐Ÿท๏ธ v2022.01

January 31, 2022

Fixes

  • Performance improvements on the homepage

  • Better handling when an influxdb problem occurs. (Agent detection)

๐Ÿท๏ธ v2021.10

Oct 18, 2021

Docker / Kubernetes

The platform is now accessible via Docker and Kubernetes.

User API

A comment property has been added to User Management API

PostgreSQL 14

Datasentinel is compatible with PostgreSQL 14, taking into account the query_id column in the sampling of active sessions (pg_stat_activity)

Progress Reporting

Real-time progress reporting for COPY operations is now implemented in the Live360 module.

๐Ÿท๏ธ v2021.07

July 26, 2021

User management via API

Manage users and roles through the API.

๐ŸงฉRole API๐ŸงฉUser API

Linux Compatibility

The platform is now available on Debian Buster and Debian Stretch distributions

Docker

The agent is available as a container image.

Agent

Fixes

  • Live360 module:

    When transitioning to a new PostgreSQL cluster, DataSentinel now automatically selects all databases when the chosen database selection is unavailable. This prevents errors from occurring.

To take advantage of this fix, ensure your agents are updated to at least version 2.6.0 or higher

๐Ÿท๏ธ v2021.05

May 01, 2021

High Availability Architecture

You now have the capability to monitor your complete architecture, including both the master and read-only replicas.

To take advantage of this feature, ensure your agents are updated to at least version 2.6.0 or higher

๐Ÿท๏ธ v2021.04

Apr 01, 2021

Homepage

Directly view the activity of your instances or groups of instances thanks to the customisable charts.

Correlate Activity Metrics.

Customizable charts have been introduced to the Session History, Top Queries, and Top Tables modules. These charts facilitate the seamless correlation of activity metrics.

๐Ÿ”€Metric Correlation

Session History

Execution statistics from pg_stat_statements are now presented in the Session History module.

Query Samples

Query samples are now collected, with a maximum of one per hour. This feature can be disabled at the instance level through the API.

Dark Mode

An icon resembling a moonlight is now situated at the top right corner of the screen. This enables users to easily toggle between dark and light modes.

Fixes

  • Sql Text format option in query dashboard

  • Live360 Blocking sessions, maintenance operations when using PostgreSQL 9.6

  • Live360 layout in sessions dashboard when using a small screen resolution

๐Ÿท๏ธ v2021.02

Feb 01, 2021

Live360

Datasentinel introduces its new Live360ยฐ feature:

Thanks to direct connections, this feature provides precision and additional information on the context, which will offer you a valuable and indispensable help during your performance analyzes:

  • Current and blocking sessions.

  • Relations Explorer, a tool designed to provide an in-depth view of statistics. This includes detailed insights into tables, indexes, columns, extended statistics, and more.

  • Disk and Memory cache usage.

  • Generate execution plans for any query and analyze them using our execution plan visualizer.

  • Real-time progress reporting for various operations such as Vacuum, Analyze, Index creation and more.

โŒšLive360

๐Ÿท๏ธ v2020.12

Dec 09, 2020

System Metrics

Datasentinel can obtain system metrics using the Agentless method by installing the system_stats extension

Top Tables

Visualize the most commonly used Tables or Indexes, based on metrics like disk reads, cache activity, or any other specified criterion.

๐Ÿ“‚Top Tables

Version Naming

New version name convention

v1.6.0

May 11, 2020

Agentless method

Introducing the latest Agentless version, offering comprehensive monitoring capabilities for a wide range of PostgreSQL instances, including:

  • AWS RDS and Aurora

  • Microsoft Azure databases, including hyperscale

  • Google Cloud SQL, as well as other cloud providers.

v1.5.0

Mar 30, 2020

Reporting

We've introduced a Reporting feature, which includes the ability to generate PDF reports. Additionally, you can create your reports programmatically using the API.

๐Ÿ“ฐReporting

Fixes

  • Fix pagination on some dashboards in the UI.

v1.4.0

Feb 18, 2020

Top Queries

Query statistics display the minimum and maximum execution time

Export Metrics

Metrics can now be directly downloaded from the user interface. JSON or CSV format

Fixes

  • Fix layout in the top queries dashboard

  • Fix tab layout in the instance dashboard

v1.3.0

Jan 14, 2020

Execution Plans

Analyzing execution plans is now simplified with the Plan Viewer feature. You have the flexibility to copy/paste existing plans in text or JSON format, as well as view them directly within the execution plans dashboard.

Index usage

Index usage statistics are now accessible, allowing you to identify the most frequently used indexes.

๐Ÿ“‚Top Tables

Fixes

  • In the Top Queries dashboard, labels display the sql text (truncated if needed) instead of the query md5 id.

v1.2.0

Dec 19, 2019

Starred Instances

You now have the option to star PostgreSQL instances. This enables you to filter and view only your starred instances.

Instance Tags

Instance tags are now visible on both the home page and the instances dashboard. This enables convenient filtering by tag for streamlined navigation.

Fixes

  • When updating a user email, the user properties are lost

  • Home page reload does not work properly in some cases

v1.1.0

Nov 12, 2019

Grafana

Upgraded to version 6.4.4

User profile

We've introduced two user profiles: Developer and Data Admin. The Developer profile offers access exclusively to the Session History and Top Queries sections.

Fixes

  • Query id with unknown filters

v1.0.0

Oct 2019

First Release

The inaugural release of Datasentinel is now available

Last updated